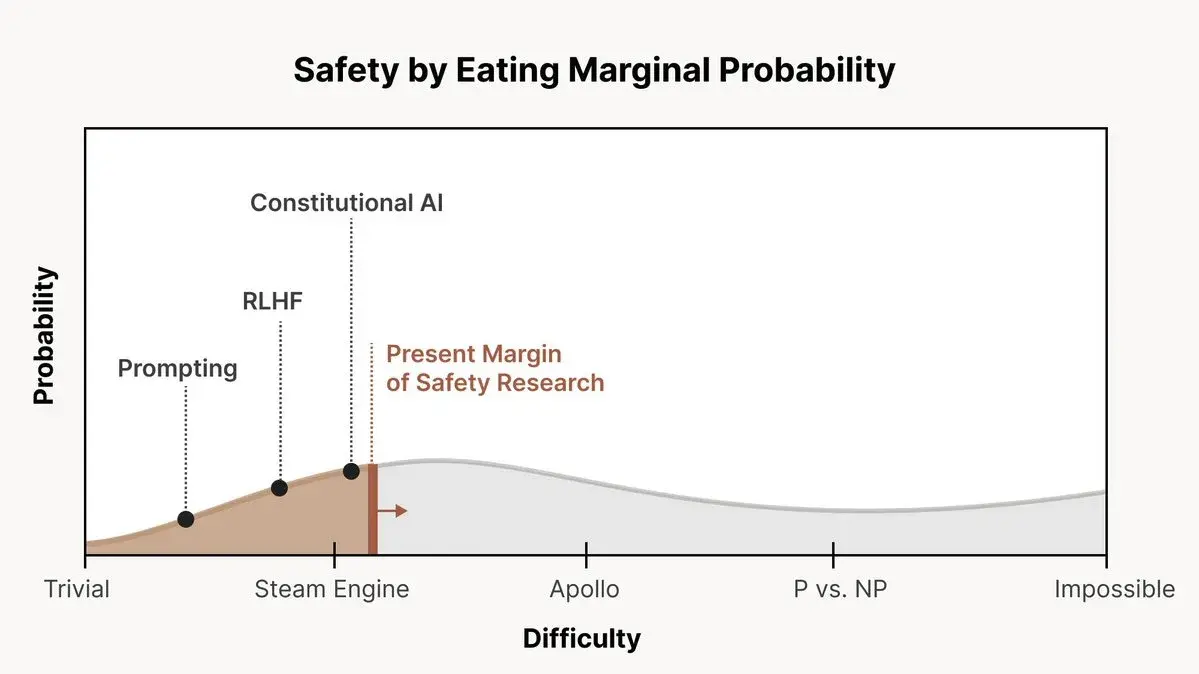
From this post; featuring “probability” with no scale on the y-axis, and “trivial”, “steam engine”, “Apollo”, “P vs. NP” and “Impossible” on the x-axis.
I am reminded of Tom Weller’s world-line diagram from Science Made Stupid.

From this post; featuring “probability” with no scale on the y-axis, and “trivial”, “steam engine”, “Apollo”, “P vs. NP” and “Impossible” on the x-axis.
I am reminded of Tom Weller’s world-line diagram from Science Made Stupid.
Everybody add your own data points, mine is Graph Creator Shits Self, just to the right of Steam Engine